When your application crashes at 3 AM during peak traffic, what separates successful developers from those scrambling in the dark? The answer lies in robust application performance monitoring and comprehensive logging strategies that provide visibility into your system’s behavior before problems escalate into disasters.
Understanding how to effectively monitor and log application performance isn’t just a technical nice-to-have, it’s a critical skill that determines whether you can proactively optimize your systems or reactively fight fires. Let’s explore the fundamental approaches that will transform how you understand and improve your application’s performance.
Why Application Performance Monitoring Matters More Than Ever
Before diving into specific techniques, consider this question: How do you currently know when your application is struggling? Are you waiting for user complaints, or do you have systems in place that alert you to performance degradation before it impacts your users?
Modern applications operate in increasingly complex environments with distributed architectures, microservices, and cloud infrastructure. This complexity makes traditional monitoring approaches insufficient. Application performance monitoring provides the observability needed to understand system behavior across these distributed components.
The consequences of poor performance monitoring extend beyond technical issues. According to research from Google, a one-second delay in page load time can reduce conversions by up to 7%. This makes performance monitoring directly tied to business outcomes.
The Five Pillars of Effective Performance Monitoring
1. Infrastructure-Level Monitoring
Infrastructure monitoring forms the foundation of application performance monitoring by tracking the underlying resources that support your applications. This includes monitoring CPU usage, memory consumption, disk I/O, and network performance across your servers, containers, or cloud instances.
Key metrics to track at the infrastructure level include:
Metric Category | Key Indicators | Typical Thresholds |
CPU Usage | Average CPU utilization, CPU load | >80% sustained |
Memory | RAM usage, swap utilization | >85% RAM usage |
Disk I/O | Read/write operations per second, disk latency | >100ms latency |
Network | Bandwidth utilization, packet loss | >1% packet loss |
Tools like Prometheus combined with Grafana provide excellent open-source solutions for infrastructure monitoring, while commercial platforms like New Relic and DataDog offer comprehensive monitoring suites.
2. Application-Level Performance Metrics
While infrastructure monitoring tells you about resource consumption, application-level monitoring reveals how your code actually performs under real-world conditions. This layer of application performance monitoring focuses on metrics specific to your application’s functionality and user experience.
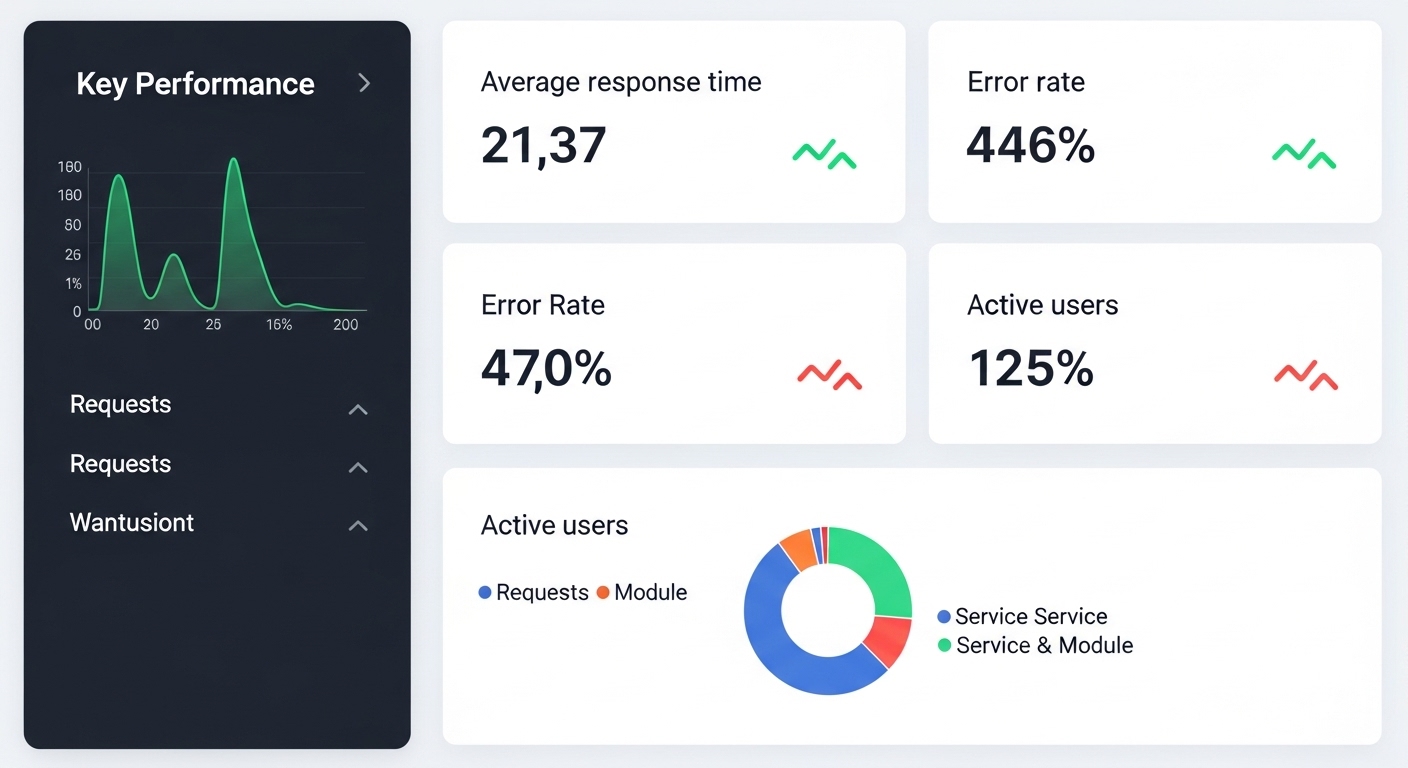
Critical application metrics include response times, throughput (requests per second), error rates, and database query performance. These metrics provide direct insight into user experience and help identify performance bottlenecks within your application logic.
Consider implementing custom metrics that align with your business logic. For an e-commerce application, you might track checkout completion times, search query performance, or product page load speeds. These domain-specific metrics often provide more actionable insights than generic application metrics.
3. Database Performance Monitoring
Database operations frequently represent the primary performance bottleneck in applications. Effective database monitoring within your application performance monitoring strategy requires tracking both database server performance and individual query execution patterns.
Essential database monitoring components include:
- Query execution times and frequency analysis
- Connection pool utilization and wait times
- Index usage and optimization opportunities
- Lock contention and deadlock detection
- Database server resource consumption
Tools like pgBadger for PostgreSQL or MySQL’s Performance Schema provide detailed query-level insights. Many APM platforms also include database monitoring capabilities that correlate database performance with application requests.
4. User Experience Monitoring
Real User Monitoring (RUM) captures actual user interactions with your application, providing insights that synthetic monitoring cannot replicate. This aspect of application performance monitoring reveals how performance varies across different user segments, geographic locations, and device types.
Key RUM metrics include page load times, time to first byte, time to interactive, and cumulative layout shift. These metrics directly correlate with user satisfaction and business outcomes.
Implementation typically involves adding JavaScript tracking code to your frontend applications. Services like Google Analytics provide basic RUM capabilities, while specialized tools offer more detailed performance insights.
5. Log Aggregation and Analysis
Comprehensive logging complements metric-based monitoring by providing detailed context about application behavior and errors. Effective log management requires standardized logging formats, centralized collection, and powerful search capabilities.
Your logging strategy should capture different log levels (DEBUG, INFO, WARN, ERROR) with appropriate detail for each level. Structure your logs with consistent formatting to enable automated analysis and correlation with performance metrics.
Implementing Structured Logging for Better Observability
How do you currently structure your application logs? Are they human-readable text files, or do you use structured formats that enable automated analysis and correlation with performance data?
Structured logging using formats like JSON enables powerful log analysis capabilities. Instead of parsing unstructured text, you can query logs using specific fields and correlate log events with performance metrics.
Example structured log entry:
{
  "timestamp": "2025-08-30T10:15:30Z",
  "level": "ERROR",
  "service": "payment-processor",
  "request_id": "req-12345",
  "user_id": "user-67890",
  "error_code": "PAYMENT_TIMEOUT",
  "response_time_ms": 5000,
  "message": "Payment gateway timeout exceeded"
}
This structure enables queries like “show all payment errors with response times greater than 3 seconds” or “correlate payment timeouts with specific user segments.”
Choosing the Right APM Tools
The application performance monitoring tool landscape offers numerous options, from open-source solutions to enterprise platforms. Your choice depends on factors including budget, technical requirements, team expertise, and integration needs.
Open-source options like the ELK stack (Elasticsearch, Logstash, Kibana) provide powerful capabilities for organizations with technical expertise to implement and maintain these systems. The Elastic Stack offers comprehensive logging and monitoring capabilities.
Commercial APM platforms like New Relic, DataDog, or AppDynamics provide turnkey solutions with extensive integrations and support. These platforms typically offer faster implementation but at higher ongoing costs.
Establishing Effective Alerting Strategies
Monitoring without appropriate alerting creates data without actionable insights. How do you currently decide what conditions warrant immediate attention versus those that can wait for business hours review?
Effective alerting requires careful threshold configuration to minimize false positives while ensuring critical issues receive immediate attention. Consider implementing tiered alerting with different notification channels for various severity levels.
Alert fatigue represents a significant challenge in application performance monitoring. Teams that receive too many non-actionable alerts often begin ignoring notifications, potentially missing critical issues. Focus on alerts that require immediate action and use dashboards for information that needs monitoring but not immediate response.
Performance Monitoring in Different Environments
Your monitoring strategy should adapt to different deployment environments. Development and staging environments need monitoring to catch performance issues before production deployment, but with different thresholds and alerting configurations.
Production monitoring requires the most comprehensive coverage with strict SLA monitoring and immediate alerting for critical issues. Consider implementing canary deployments with enhanced monitoring to detect performance regressions during releases.
Cloud environments offer additional monitoring capabilities through provider-specific tools like AWS CloudWatch, Azure Monitor, or Google Cloud Operations. These tools provide deep integration with cloud services but may require supplementation with application-specific monitoring.
Correlation and Root Cause Analysis
The true value of comprehensive application performance monitoring emerges when you can correlate data across different monitoring layers to identify root causes of performance issues. This requires tools and processes that can connect infrastructure metrics, application performance data, and log events.
Distributed tracing becomes essential in microservices architectures, allowing you to follow individual requests across multiple services and identify where performance bottlenecks occur. Tools like Jaeger or Zipkin provide open-source distributed tracing capabilities.
When performance issues occur, your monitoring data should enable you to quickly answer questions like: Which component is causing the slowdown? Are infrastructure resources constraining performance? Have recent code changes introduced performance regressions?
Continuous Improvement Through Performance Analytics
Effective application performance monitoring extends beyond reactive issue resolution to proactive performance optimization. Regular analysis of performance trends can identify opportunities for optimization before they impact users.
Establish regular performance reviews that analyze trends in key metrics, identify optimization opportunities, and assess the impact of performance improvements. This data-driven approach to performance management helps prioritize development efforts and demonstrates the business value of performance initiatives.
Consider implementing performance budgets that define acceptable thresholds for key metrics. These budgets can be enforced through automated testing and deployment pipelines, preventing performance regressions from reaching production.
Conclusion: Building a Sustainable Monitoring Practice
Mastering application performance monitoring requires combining the right tools, processes, and organizational practices to create comprehensive visibility into your application’s behavior. The techniques outlined in this guide provide a foundation for building robust monitoring capabilities that enable proactive performance management.
Monitoring is not a one-time implementation but an ongoing practice that evolves with your application and infrastructure. Start with basic monitoring of key metrics, then gradually expand your capabilities as you gain experience and identify specific monitoring needs.
The investment in comprehensive performance monitoring pays dividends through improved user experience, reduced incident response times, and the ability to proactively optimize your applications. Begin implementing these monitoring practices today, and you’ll be prepared to handle the performance challenges of tomorrow’s increasingly complex application environments.

